- As gamma rays leave their emission source (heart) other objects of density will get in its way reducing the photon yeild, creating areas of reduced activity on the final image.
- These artifacts occur within the human system, would include: breast, lateral fat, diaphram, ribs
- By applying a transmission source areas of increased density can be identified
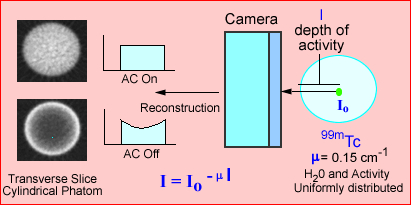
- In a homogenous source of emitting radiation (example: brain and liver/spleen) attenuation correction maps can calculated mathmatically. The following segment is from your CLRS 344 lecture entitled, "SPECT-Attenuation and Scatter." For more detailed information please visit your CLRS 344 website
- Measurements of photons being attenuated as a function of distance
- The above image on the left defines activity without attenuation correction while the one on the right has attenuation correction. Profile and graft notes count distribution with both images
- What is interesting is that an image without attenuation correction shows significant loss of activity in the center of a homogenous volume of liquid. Additionally, the activity is more hotly distributed along the edge of the image
- What is the cause of this? This problem relates to the graph comparing the different energy gammas, specifically its an attenuation problem. The further away the activity has to travel the greater the amount of attenuation occurs, hence the center of the activity shows falsely reduce activity in its volume
- For this reason an attenuation coefficient (correction) must be applied to the reconstruction process which should improve image quality
- From a filtering standpoint this, application of an attenuation correction can be mathimatically, as long as the volume being imaged is homogenous, such as the brain
- Applying the right attenuation filter falsely raises the activity in the center hypothetically accounting for the attenuated gamma rays
- Attenuation correction can be applied either to raw data (Sorenson filter) or during the reconstruction process (Chang filter)
- Another term for these filters is first-order attenuation correction and should only be applied when homogenaity is involved, such as the liver or brain
- An example of an incorrect appication would be the heart. Why? Consider the numerous surrounding structures with varying densities. This would require multiple attenuation coefficient applied only to areas that correlate to the appropriate density. Therefore, a coefficient approach to correct for attenuation becomes impossible.
- Furthermore low energy gammas emitters are not recommended for the first-order filters
- Consider cardiac imaging with the administration of 201Tl?
- In the case of imaging an organ or disease where there are multiple densities within the media a transmission source (CT or rod) is recommended. This is the only wsay you can correct for heterogeneous densities
- Use of a transmission source can be done with either a radioactive rod source attached to a fan-beam collimator or with an x-ray tube (CT is the best example) - See below
- Application of attenuation correction to heterogenous or homogeneous exams is recommended
- Rod source
- Recommend 153Gd (100 keV and 30 keV) for 201Tl
- Recommned 57Co (~130 keV) for 99mTc
- Rod sources have similar applications to the CT tube. See
- CT correction - From your CLRS 344 lecture. While this application discuss PET/CT the same similarities can be drawn from SPECT/CT. The only major difference is that SPECT gamma rays would have significantly less energy which would mean that there would be a difference in CT and SPECT correction factors
- SPECT - Attenuation and Scatter
- Application of CT Attenuation with PET images
- We will discuss one of several methods used to correct attenuation densities in a PET scan. PE Kinahan and his associates discuss the development and application of CT attenuation and its role with in PET
- What is scaling and why does it need to be applied in CT attenuation?
- 511 keV gammas for PET interact differently than its CT counterpart (70 - 140 kVp)
- Reason - First there is greater attenuation with lower energy x-ray. In this energy range, when compared to PET gammas, there is greater photoelectric and Compton interaction. On the other hand because of PET gamma rays have a significantly higher energy there is less Photoelectric and Compton interaction.
- When comparing PET to CT the probability of x-rays interacting with air, water, and soft tissue is approximately 1.9. Furthermore, Photoelectric effect increases by 13% when CT x-rays encounter bone, while PET gamma rays increase by just 3%.
- Why do x-rays and gamma ray interactions increase in the Photoelectric range when encountering bone? (1) the presence of calcium and phosphorous in the bone and (2) these elements have higher Z values when compared to the surrounding media
- Therefore, it is important to scale CT x-ray for proper correlation of attenuation in the 511 keV range
- Monochromatic gamma vs. polychromatic x-ray
- PET gamma rays always have the exact same energy, 511 keV
- CT x-rays vary in their energy beam, even when it is set at a specific energy level. Usually there is at least a 1% variation within any given setting. This fluctuation causes a slight variation within any given attenuation coefficient
- Segmentation
- This is a process in which attenuated CT values are converted to known : values of specific tissues found in the body
- Given a certain threshold with the CT x-ray the specific tissue type is identified
- In general, there is a choice between: bone, soft tissue, and lung
- One minor problem with this approach occur when certain types of tissue have variation in density
- As an example consider the lungs. Within the thorax you will encounter soft tissue (heart), lung (has air), and ribs (bone)
- Once the different tissue types are identified Scaling and Segmentation are applied
- Segmentation defines the specific organ or tissue type and applies the correct attenuation
- Scaling (ratios) for bone, soft tissue, and air will further adjusts the attenuation map to the 511keV gamma
- General application of attenuated maps in PET
- Increased density translates to higher CT attenuation coefficients which in turn will increase the amount of counts in the same region of the corrected PET images
- Decreased density translates to lower CT attenuation coefficients that will reduce the amount of counts in the corrected PET image
- It is very important that co-registration of CT and PET occur for appropriate pixel to pixel alignment
- Matrix size must be adjusted. Remember CT has 512 x 512 and PET has 1258 x 128
- Artifacts occur when there is a density mismatch
- Remember to always look at your raw data: CT and PET
- Using a two head camera, the detectors are set perpendicular to each other
- Line sources are set parallel to the detector head with the patient between the line sources and the detector heads
- The source activity should closely match the radiopharmaceutical being used to image the myocardium
- Air in lungs will have less density and therefore collect more data because of the reduced attenuation
- Bone or water will be more dense and therefore collect less data do to the increased attenuation
- Attenuation maps are acquired with each SPECT imaige, 32 to 64 images
- Emission data from the myocardial perfusion agent is collected for each frame acquired
- Reconstruction of the attenuation maps and emission data is then processed
- Where there is increased density gamma counts are added
- Where there is decreased density gamma counts are subtracted
- Improves image quality
- Imaging artifacts such as the diaphragm and/or breast are reduced or eliminated
- Without the transmission data, artifacts might be interpreted as defects within the myocardium
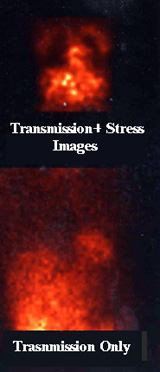
- On display are two images: one is 99mTc-sestamibi image (emission) combined with the transmission data and the other image is just the transmission data. Both images are taken in the same plain
- The next set of images are reconstructed images of the short axis
- On display are two images: one is 99mTc-sestamibi image (emission) combined with the transmission data and the other image is just the transmission data. Both images are taken in the same plain
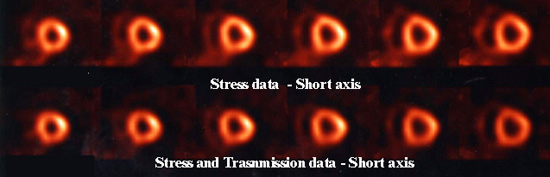
- The first set shows just the emission data only
- The second set shows what the same images look like when emission and transmission data are combined
- The only major difference noted here in these combined images are a decreased background, hence a slight improvement in image quality